- Exam: IELTS
- Course: WRITING
- Part 1, Exam 1
Instructions
Complete the document given by dragging and dropping, or typing, the correct answers into the spaces provided, from the list given alongside.
The finished document will be a model answer for this part of the exam.
WRITING: DESCRIBING A GRAPH
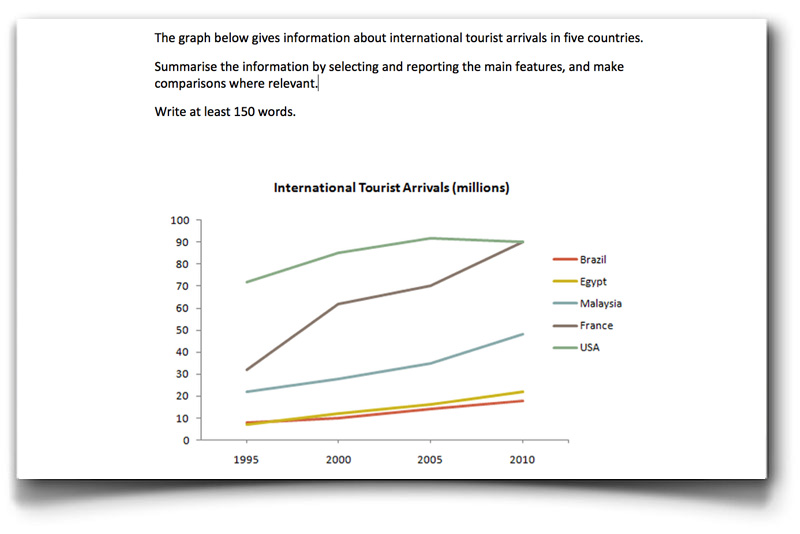
The graph shows
the overall numbers of tourist arrivals in five countries (1)
1995 and 2010. It can clearly be (2)
that although The USA had the highest number of visitors and Brazil the (3)
, all the destinations showed an increase, but France had the highest (4)
of increase and The USA the lowest.
In 1995 over 70 million tourists visited the United States, more (5)
twice as many as the next most popular destination shown, France. However, between 2005 (6)
2010 there was a decrease of approximately 1,500,000 in the numbers going (7)
the United States whereas there was an increase of nearly 20 million tourists visiting France. The result
was that in 2010 the number of tourists arriving in the United States and France was almost (8)
at around 90 million each. The number of tourists visiting Malaysia rose (9)
over the whole period but by 2010 the total was still under 50 million. The countries with the (10)
tourist arrivals were Brazil and Egypt. The number of tourists going there was similar between 1995 and 2000 but after that there was a (11)
increase in tourists going to Egypt than to Brazil.
This graph shows a major change in the destinations (12)
chosen by tourists. The old favourite, the USA is rapidly being replaced by new destinations, (13)
France and Malaysia.
Possible answers:
- A) lowest
- B) and
- C) equal
- D) especially
- E) between
- F) rate
- G)steadily
- H) seen
- I) being
- J) fewest
- K) greater
- L) to
- M) than